↧
WMI+Report.xml
↧
Credentials Used By WMI Nodes
↧
↧
Current - Hardware Status with Problems 11.5.OrionReport
↧
Volume Usage Spike Detection Alert
↧
SolarWinds Website Redirection HTTP > HTTPS
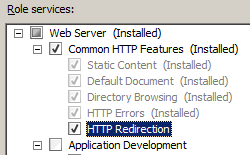
Make sure http Redirection is installed in Role Status.
WINDOWS SERVER 2008 OR WINDOWS SERVER 2008 R2
- On the taskbar, clickStart, point toAdministrative Tools, and then clickServer Manager.
- In theServer Managerhierarchy pane, expandRoles, and then clickWeb Server (IIS).
- In theWeb Server (IIS)pane, scroll to theRole Servicessection, and then clickAdd Role Services.
- On theSelect Role Servicespage of theAdd Role Services Wizard, expandCommon Http Features, selectHTTP Redirection, and then clickNext.
![]()
- On theConfirm Installation Selectionspage, clickInstall.
- On theResultspage, clickClose.
- Now follow the steps below with Orion Website to and remove the port 80 bindings add https 443 .
- Right Click on "SolarWinds NetperfMon" Edit Bindings.
![https defult website.jpg]()
- You can select your SSL company Certificate i have just used the default provided during installation .
- See post below for more details .
- Installing an SSL Certificate in Windows Server 2008 (IIS 7.0)

Redirection from http to https (if required )
You can use the Default IIS Website however if you do not see that website you can create to use for you .

.
If you do not have Default one simply create new website choosing any path and any name as you wish
If you have the Default Website Skip the "Add New Site "


Now Select the Default Website Click Http Redirect

You can chose options in "Redirect request to this destination:

Now every request to access port http 80 will be redirected to 443 http

any question please include.
↧
↧
Repetitive Email Alerts (Noise) - MUST HAVE REPORT!!!
< BACK TO TO THE MAGIC OF SQL SCRIPTS SERIES LIST
My Dear Thwackers,
If you are sick and tired of having to deal with continuous noise from hundreds of alerts and customer complaints due to missed problems - you must have this report, now!
Fact: 80% of your alerts and frustrations come from 20% of stuff within your infrastructure!
It is quite obvious that most of the negative impact on performance and productivity within the NOC is being caused by noise and repetitive alerts that is just keep coming through... non-stop. Ability to highlight them in a most efficient manner has never been easy, until now
I am here to offer you a gift - a custom made report that has served us for years in attacking and eliminating all the noise. It is compatible with Orion Platform 2015.1.2, NPM 11.5+ (also works with latest NPM 12)
Download > Import > Run > Action
... and just for fun - please publish a screenshot in the comments below of the top 5 stats that you will get- it is very interesting to know how this will play out in your environment

To your monitoring success,
Alex Soul
[UPDATES]
[30/08/2017]: Below we have discussed some bug fixes around extracting EmailTo from description. In the attached report this workaround was implemented, so, it should work for you straight out-of-the-box
[31/08/2017]: I have added % column, which will calculate percentage from total umber of email alerts sent over the defined period. I have also updated they way variables are being defined, so, you can now just open SQL script and change them all in one place defined in SET function on top of the script


[04/09/2017]: As suggested by tdanner - there is a better way of extracting EmailTo and EmailCC. This has been implemented in version 1.3 of the report
↧
Custom SWQL VM Manager
↧
TestPoller12b3
↧
TestPoller12b3v2
↧
↧
Fortimanager CPU and Memory
↧
Cisco ISR ASR CPU Memory
↧
Group status bullseye style charts
↧
Building Simple PerfStack Templates With SWQL
As the title states, I will attempt to show you how to build quick, and simple, PerfStack templates using SWQL queries. My intent is to keep it simple here, so I will NOT be going into anything that requires you to be a world class rocket surgeon.
Here is an easy way to build a list of saved PerfStack projects: Building Simple PerfStack Project Lists With SWQL
Basically, I just need a quick and easy way to build PerfStack views in bulk. When manually building a PerfStack dashboard, you are actually building the URL as you are adding the various metrics. I am simply taking that URL, and stamping it out across all nodes at once. I want to be able to build a handful of templates, to allow my team to quickly troubleshoot issues as they are occurring. I do NOT want to have someone building a PerfStack dashboard during the outage. I do, however, want them to have access to this super awesome tool, but it needs to be useful in the heat of battle. I think we will all get there, in time, but maybe this will work for now...?
Okay, in the spirit of keeping it simple, let's just start things out with a few metrics per node. More specifically, I am going to build a template that shows me the basic metrics for CPU, memory, response time, alerts, and events. Now, let's break this down...
Example NodeID: 1234
CPU
Orion.CPULoad.MinLoad
Orion.CPULoad.MaxLoad
Orion.CPULoad.AvgLoad
If you go through the steps to manually create your PerfStack dashboard, you would need to do the following:
Select the node you want.
Select the type of metrics you want.
Drag each node metric over to the graph section you want.
Using the min, max, avg cpu load metrics, on our example node (nodeid=1234), and having each on its own graph box, your URL would look something similar to this:
http://{orionserver}/ui/perfstack/?presetTime=last12Hours&charts=0_Orion.Nodes_1234-Orion.CPULoad.MinLoad;0_Orion.Nodes_1234-Orion.CPULoad.MaxLoad;0_Orion.Nodes_1234-Orion.CPULoad.AvgLoad;
And your PerfStack dashboard would look something like this:

All in all, pretty simple and easy to do.
Now, would you want to do that for each of the 1500, 5000, or 10000+ nodes you are monitoring? If so, I reckon there is no need for you to keep reading. In fact, you best get back to mass producing those graphs on your one person assembly line. For the rest of us, let's look at a simple solution.
Add a "Custom Query" resource to a summary page, and then add the following query into the resource.
SELECT
Caption
,'PerfStack_Template_A' AS [PerfStack-A]
,'/ui/perfstack/?presetTime=last12Hours&charts=0_Orion.Nodes_' + TOSTRING(NodeID) + '-Orion.CPULoad.MinLoad;0_Orion.Nodes_' + TOSTRING(NodeID) + '-Orion.CPULoad.MaxLoad;0_Orion.Nodes_' + TOSTRING(NodeID) + '-Orion.CPULoad.AvgLoad;' AS [_LinkFor_PerfStack-A]
FROM Orion.Nodes
And, to make things a bit easier to navigate, enable the search option, and drop in the following query: (This is certainly not required, but will surely assist in tracking down the node you want to investigate.)
SELECT
Caption
,'PerfStack_Template_A' AS [PerfStack-A]
,'/ui/perfstack/?presetTime=last12Hours&charts=0_Orion.Nodes_' + TOSTRING(NodeID) + '-Orion.CPULoad.MinLoad;0_Orion.Nodes_' + TOSTRING(NodeID) + '-Orion.CPULoad.MaxLoad;0_Orion.Nodes_' + TOSTRING(NodeID) + '-Orion.CPULoad.AvgLoad;' AS [_LinkFor_PerfStack-A]
FROM Orion.Nodes
WHERE
Caption LIKE '%${SEARCH_STRING}%'
After saving/submitting your resource, you should see something that looks like this:

See, nothing fancy... Just a simple little node search box, with a link to something.
Now check out what in one of those links...

Hmm... That looks awfully familiar... Only... You didn't have to build anything... And, whats more, it's already built for EVERY node you are monitoring.
Okay, I admit, that graph template is not all that impressive, and probably not worth much of anything... However, (yeah, there's always a however...) we can easily make a couple of changes, which should make this more helpful.
Instead of having each different CPU metric on its own graph box, let's group all 3 of them together in the same box.
This is easily accomplished by changing the inner semicolons to commas.
SELECT
Caption
,'PerfStack_Template_A' AS [PerfStack-A]
,'/ui/perfstack/?presetTime=last12Hours&charts=0_Orion.Nodes_' + TOSTRING(NodeID) + '-Orion.CPULoad.MinLoad,0_Orion.Nodes_' + TOSTRING(NodeID) + '-Orion.CPULoad.MaxLoad,0_Orion.Nodes_' + TOSTRING(NodeID) + '-Orion.CPULoad.AvgLoad;' AS [_LinkFor_PerfStack-A]
FROM Orion.Nodes
After changing those 2 semicolons to commas, this is what our graph looks like: (since the min, max, & avg are all the same, our graph looks pretty well hidden, but as you can see on the right side, all 3 metrics are still there.)

Now, let's add some more stuff, and finish this thing up...
We are going to add the remaining items from our initial list (memory, response time, alerts, & events)
To show our progress, we are going to add new lines to our query, keeping the first draft the same. This will give us the ability to build different templates, and access them from a central place.
We are going to keep similar metrics together in the same graph box, as we did with the CPU Load metrics. We will end up with a single graph box which contains all of the CPU Load metrics, another with memory, another with response time, etc..
You are simply taking each of the individual metrics groups, and combining them together, into a single URL.
Use a comma to keep metrics in the same graph box, and use a semicolon to end the selection of each graph box.
Using the example below, first remove all of the lines that start with "--", as well as all blank/empty lines.
--CPU Load:
,'/ui/perfstack/?presetTime=last12Hours&charts=
0_Orion.Nodes_' + TOSTRING(NodeID) + '-Orion.CPULoad.MinLoad,
0_Orion.Nodes_' + TOSTRING(NodeID) + '-Orion.CPULoad.MaxLoad,
0_Orion.Nodes_' + TOSTRING(NodeID) + '-Orion.CPULoad.AvgLoad;

--Memory:
0_Orion.Nodes_' + TOSTRING(NodeID) + '-Orion.CPULoad.TotalMemory,
0_Orion.Nodes_' + TOSTRING(NodeID) + '-Orion.CPULoad.MinMemoryUsed,
0_Orion.Nodes_' + TOSTRING(NodeID) + '-Orion.CPULoad.MaxMemoryUsed,
0_Orion.Nodes_' + TOSTRING(NodeID) + '-Orion.CPULoad.AvgMemoryUsed;

--ResponseTime:
0_Orion.Nodes_' + TOSTRING(NodeID) + '-Orion.ResponseTime.AvgResponseTime,
0_Orion.Nodes_' + TOSTRING(NodeID) + '-Orion.ResponseTime.MinResponseTime,
0_Orion.Nodes_' + TOSTRING(NodeID) + '-Orion.ResponseTime.MaxResponseTime,
0_Orion.Nodes_' + TOSTRING(NodeID) + '-Orion.ResponseTime.Availability;

--Alerts & Events:
0_Orion.Nodes_' + TOSTRING(NodeID) + '-Orion.PerfStack.Alerts,
0_Orion.Nodes_' + TOSTRING(NodeID) + '-Orion.PerfStack.Events;'
Then, just backspace the lines together, starting from the last row, and going up, until they look like this:
,'/ui/perfstack/?presetTime=last12Hours&charts=0_Orion.Nodes_' + TOSTRING(NodeID) + '-Orion.CPULoad.MinLoad,0_Orion.Nodes_' + TOSTRING(NodeID) + '-Orion.CPULoad.MaxLoad,0_Orion.Nodes_' + TOSTRING(NodeID) + '-Orion.CPULoad.AvgLoad;0_Orion.Nodes_' + TOSTRING(NodeID) + '-Orion.CPULoad.TotalMemory,0_Orion.Nodes_' + TOSTRING(NodeID) + '-Orion.CPULoad.MinMemoryUsed,0_Orion.Nodes_' + TOSTRING(NodeID) + '-Orion.CPULoad.MaxMemoryUsed,0_Orion.Nodes_' + TOSTRING(NodeID) + '-Orion.CPULoad.AvgMemoryUsed;0_Orion.Nodes_' + TOSTRING(NodeID) + '-Orion.ResponseTime.AvgResponseTime,0_Orion.Nodes_' + TOSTRING(NodeID) + '-Orion.ResponseTime.MinResponseTime,0_Orion.Nodes_' + TOSTRING(NodeID) + '-Orion.ResponseTime.MaxResponseTime,0_Orion.Nodes_' + TOSTRING(NodeID) + '-Orion.ResponseTime.Availability;0_Orion.Nodes_' + TOSTRING(NodeID) + '-Orion.PerfStack.Alerts,0_Orion.Nodes_' + TOSTRING(NodeID) + '-Orion.PerfStack.Events;'
Finally, just add that newly combined row to your query, which will then look like this: (Don't forget to add your SWQL _LinkFor_ alias to the end of the line, so it matches the alias name)
SELECT
Caption
,'PerfStack_Template_A' AS [PerfStack-A]
,'/ui/perfstack/?presetTime=last12Hours&charts=0_Orion.Nodes_' + TOSTRING(NodeID) + '-Orion.CPULoad.MinLoad,0_Orion.Nodes_' + TOSTRING(NodeID) + '-Orion.CPULoad.MaxLoad,0_Orion.Nodes_' + TOSTRING(NodeID) + '-Orion.CPULoad.AvgLoad;' AS [_LinkFor_PerfStack-A]

,'PerfStack_Template_Z' AS [PerfStack-Z]
,'/ui/perfstack/?presetTime=last12Hours&charts=0_Orion.Nodes_' + TOSTRING(NodeID) + '-Orion.CPULoad.MinLoad,0_Orion.Nodes_' + TOSTRING(NodeID) + '-Orion.CPULoad.MaxLoad,0_Orion.Nodes_' + TOSTRING(NodeID) + '-Orion.CPULoad.AvgLoad;0_Orion.Nodes_' + TOSTRING(NodeID) + '-Orion.CPULoad.TotalMemory,0_Orion.Nodes_' + TOSTRING(NodeID) + '-Orion.CPULoad.MinMemoryUsed,0_Orion.Nodes_' + TOSTRING(NodeID) + '-Orion.CPULoad.MaxMemoryUsed,0_Orion.Nodes_' + TOSTRING(NodeID) + '-Orion.CPULoad.AvgMemoryUsed;0_Orion.Nodes_' + TOSTRING(NodeID) + '-Orion.ResponseTime.AvgResponseTime,0_Orion.Nodes_' + TOSTRING(NodeID) + '-Orion.ResponseTime.MinResponseTime,0_Orion.Nodes_' + TOSTRING(NodeID) + '-Orion.ResponseTime.MaxResponseTime,0_Orion.Nodes_' + TOSTRING(NodeID) + '-Orion.ResponseTime.Availability;0_Orion.Nodes_' + TOSTRING(NodeID) + '-Orion.PerfStack.Alerts,0_Orion.Nodes_' + TOSTRING(NodeID) + '-Orion.PerfStack.Events;' AS [_LinkFor_PerfStack-Z]

FROM Orion.Nodes
The End Result:
Here is my simple little SWQL query that will give you examples for each of the different basic metric types we used in the many, many, many words above.
PerfStack-A = CPU Load
PerfStack-B = Memory Used
PerfStack-C = Response Time
PerfStack-D = Alerts & Events
PerfStack-Z = All of the above
SELECT
Caption
,'PerfStack_Template_A' AS [PerfStack-A]
,'/ui/perfstack/?presetTime=last12Hours&charts=0_Orion.Nodes_' + TOSTRING(NodeID) + '-Orion.CPULoad.MinLoad,0_Orion.Nodes_' + TOSTRING(NodeID) + '-Orion.CPULoad.MaxLoad,0_Orion.Nodes_' + TOSTRING(NodeID) + '-Orion.CPULoad.AvgLoad;' AS [_LinkFor_PerfStack-A]

,'PerfStack_Template_B' AS [PerfStack-B]
,'/ui/perfstack/?presetTime=last12Hours&charts=0_Orion.Nodes_' + TOSTRING(NodeID) + '-Orion.CPULoad.TotalMemory,0_Orion.Nodes_' + TOSTRING(NodeID) + '-Orion.CPULoad.MinMemoryUsed,0_Orion.Nodes_' + TOSTRING(NodeID) + '-Orion.CPULoad.MaxMemoryUsed,0_Orion.Nodes_' + TOSTRING(NodeID) + '-Orion.CPULoad.AvgMemoryUsed;' AS [_LinkFor_PerfStack-B]

,'PerfStack_Template_C' AS [PerfStack-C]
,'/ui/perfstack/?presetTime=last12Hours&charts=0_Orion.Nodes_' + TOSTRING(NodeID) + '-Orion.ResponseTime.AvgResponseTime,0_Orion.Nodes_' + TOSTRING(NodeID) + '-Orion.ResponseTime.MinResponseTime,0_Orion.Nodes_' + TOSTRING(NodeID) + '-Orion.ResponseTime.MaxResponseTime,0_Orion.Nodes_' + TOSTRING(NodeID) + '-Orion.ResponseTime.Availability;' AS [_LinkFor_PerfStack-C]

,'PerfStack_Template_D' AS [PerfStack-D]
,'/ui/perfstack/?presetTime=last12Hours&charts=0_Orion.Nodes_' + TOSTRING(NodeID) + '-Orion.PerfStack.Alerts,0_Orion.Nodes_' + TOSTRING(NodeID) + '-Orion.PerfStack.Events;' AS [_LinkFor_PerfStack-D]

,'PerfStack_Template_Z' AS [PerfStack-Z]
,'/ui/perfstack/?presetTime=last12Hours&charts=0_Orion.Nodes_' + TOSTRING(NodeID) + '-Orion.CPULoad.MinLoad,0_Orion.Nodes_' + TOSTRING(NodeID) + '-Orion.CPULoad.MaxLoad,0_Orion.Nodes_' + TOSTRING(NodeID) + '-Orion.CPULoad.AvgLoad;0_Orion.Nodes_' + TOSTRING(NodeID) + '-Orion.CPULoad.TotalMemory,0_Orion.Nodes_' + TOSTRING(NodeID) + '-Orion.CPULoad.MinMemoryUsed,0_Orion.Nodes_' + TOSTRING(NodeID) + '-Orion.CPULoad.MaxMemoryUsed,0_Orion.Nodes_' + TOSTRING(NodeID) + '-Orion.CPULoad.AvgMemoryUsed;0_Orion.Nodes_' + TOSTRING(NodeID) + '-Orion.ResponseTime.AvgResponseTime,0_Orion.Nodes_' + TOSTRING(NodeID) + '-Orion.ResponseTime.MinResponseTime,0_Orion.Nodes_' + TOSTRING(NodeID) + '-Orion.ResponseTime.MaxResponseTime,0_Orion.Nodes_' + TOSTRING(NodeID) + '-Orion.ResponseTime.Availability;0_Orion.Nodes_' + TOSTRING(NodeID) + '-Orion.PerfStack.Alerts,0_Orion.Nodes_' + TOSTRING(NodeID) + '-Orion.PerfStack.Events;' AS [_LinkFor_PerfStack-Z]

FROM Orion.Nodes
The SWQL query above should show you a resource similar to:

And the "PerfStack-Z" template should build out to something like this:

**There is really no need to save this dashboard (that I know of, anyway), as the link will just open up the same exact thing, every time. However, if you wanted to use this as a jumping off point, adding other metrics for other nodes/interfaces/etc., it would probably be best to save it.**
While this is really only building single node "templates", you can add multiple nodes to a single graph with a quick copy paste, or some decent SWQL skills (which I am obviously lacking, as I don't have any a multi-node query ready yet...).
For example, the following would show the Average CPU Load for NodeIDs 1234 & 5678, on the same graph box.
0_Orion.Nodes_1234-Orion.CPULoad.AvgLoad,0_Orion.Nodes_5678-Orion.CPULoad.AvgLoad;
There is a browser/URL limitation, so, eventually, once the URL gets too long, it will not work. I believe this is why they convert the URL into a stored name, to circumvent the issue. Having said that, if you do build a super long URL, just update the database directly. (insert buyer beware, backup early, backup often, etc... )
This is, by no means, the best way to accomplish bulk "pre-built" templates for troubleshooting. However, maybe it will hold you over until the next release of PerfStack...?
For more ways to customize your SolarWinds environment, make sure to check out this link, by CourtesyIT
How to do various customizations with your Solarwinds
Thank you,
-Will
↧
↧
Palo Alto Node Details
↧
Microsoft Teams Integration with Orion Alerts
With the new release of Microsoft Teams, I got a tad curious and went to see what integrations were available.
Much like Slack, PagerDuty, and a host of others; Teams gleefully accepts incoming webhooks as a native integration. Below is a summary of how to achieve this in your Teams environment.
Step 1:
As an administrator of your organization's Team software, login to your Teams desktop application and click on the Team that you wish to add your integration to, then select "Connectors"

Step 2:
Search for "Incoming Webhook" and click "Add"

Step 3:
Name your new Webhook, add an optional Icon, and click "Create"

Step 4:
Copy your URL to be used with your alert action in a moment

Step 5:
At this point, you should see that you have a newly configured Webhook in your Connectors list and you should also have a new message in your Team reflecting this addition as well


Step 6:
Configure an alert action (Send a GET or POST Request To A Web Server) and include your Webhook URL and associated payload (example below)

Step 7:
Enjoy your new feed of alerts!

Here's the payload snippet I am using in my action at present:
{  "title": "ALERT TRIGGER: ${N=SwisEntity;M=Caption} is currently ${N=SwisEntity;M=Status}",  "text": "DEVICE: [${N=SwisEntity;M=Caption}](${N=SwisEntity;M=DetailsUrl})  IP ADDRESS: ${N=SwisEntity;M=IP_Address}  VENDOR: ${N=SwisEntity;M=Vendor}  MODEL: ${N=SwisEntity;M=MachineType}  [ALERT DETAILS](${N=Alerting;M=AlertDetailsUrl})  [ACKNOWLEDGE THIS ALERT](${N=Alerting;M=AcknowledgeLink})"
}
Please note that there is some good information to be found in the API Reference as well: Office 365 Connectors API Reference - Outlook Dev Center
Enjoy!
↧
Interface+Count+by+Node+Name.xml
↧
Time Zone Clocks using javascript
↧
↧
Group status pie charts
Here's the source code/implementation for the pie chart version of the bullseye charts first mentioned in and later elaborated upon here.
Prequisites
- You must know the Group ID of the group you wish to display in the chart. The easiest way to find this is to go to the details page for the group and get the group number from the end of the URL. E.g. if the URL is https://solarwinds.yourcompany.com/Orion/NetPerfMon/ContainerDetails.aspx?NetObject=C:69, the group ID is 69.
- SQL Server 2012 or newer. If you have an older version of SQL Server, see the note about "Older versions of SQL Server" at the end of this document.
Installation
- Download and unzip the attached archive.
- Copy GroupMemberAggregateStatus.aspx and GroupMemberAggregateStatus.aspx.cs to <Solarwinds install volume>\InetPub\SolarWinds\Orion\NetPerfMon\ .
Implementation
- On your Solarwinds NOC view page, click "Customize Page" in the page's upper right corner.
- Add a new Custom HTML resource and save your changes.
- Find the new Custom HTML resource on the page and click the "EDIT" box in the resource's upper right corner.
- Fill in the Title and Subtitle fields as you wish and check the "Use synchronous loading" box.
- Copy and paste the HTML below into the (unlabeled) URL field.
<iframe scrollbars="none" height="170px" width="100%" src="/Orion/NetPerfMon/GroupMemberAggregateStatus.aspx?ContainerID=GROUPID" ></iframe>
Replace GROUPID in the URL with the ID number of the group you want to display. Your resource, when completely filled in, will look similar to this:![]()
- Click "Submit" to save your changes.

Example of a single chart

Older versions of SQL Server
If your installation uses a version of SQL Server older than SQL Server 2012, you must edit GroupMemberAggregateStatus.aspx.cs. Find both instances of the string
concat('/Orion/NetPerfMon/ContainerDetails.aspx?NetObject=C:',C.ContainerID)and replace it with
'/Orion/NetPerfMon/ContainerDetails.aspx?NetObject=C:'+cast(C.ContainerID as varchar)
This will continue to work after you upgrade to SQL Server 2012.
↧
IronPort X1060
Hi,
I created a UnDP and Poller for our IronPort X1060 running ASyncOS 7.6
CPU and memory usage are correctly polled
Values collected by UnDP:
- fanRPMs
- mailTransferThreads
- memoryAvailabilityStatus
- oldestMessageAge
- outstandingDNSRequests
- pendingDNSRequests
- perCentCPUUtilization
- perCentDiskIOUtilization
- perCentMemoryUtilization
- perCentQueueUtilization
- powerSupplyStatus
- queueAvailabilityStatus
- raidStatus
- resourceConservationReason
- workQueueMessages
Disk usage is missing but I could not find how to poll it at all, if anyone has an idea...
↧
CheckPoint Firewalls Universal Device Pollers - v2
Based on the brilliant poller from humejo
Checkpoint Firewalls Universal Device Pollers
I added the following:
fwConnTableLimit
fwNumConn
fwPeakNumConn
change log:
18/04/2018
- The following have been changed from Rate to Counter so that it is properly displayed in graphs:
- Accepted packets
- Dropped packets
- Logged Packets
- Rejected packets
- Added warning/error thresholds for
- Number of connections
- SIC Trust State
- HA blocking state
- Fixed minor typos
↧